Does Hively provide any reporting data?
Hively has a set of general reporting capabilities which are available to all customers, as well as some advanced reporting capabilities which are available to customers on paid plans.
General Reporting
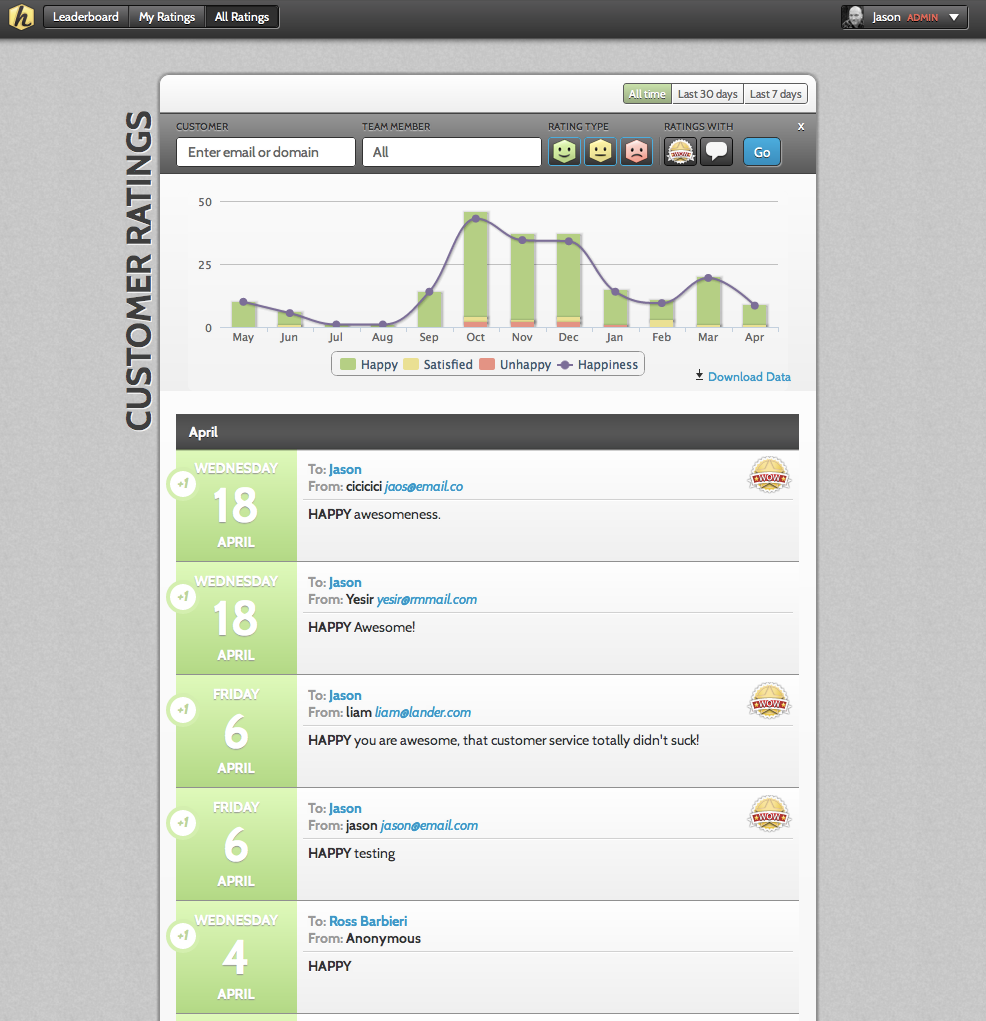
Hively provides you with data on your customer happiness and team member performance on the ‘All Ratings’ page. This page is accessible by all Team Leaders and Account Administrators. For Team Leaders, only ratings for members of their team or teams is shown whereas for Account Administrators, ratings for all team members are shown.
To get here, click on the ‘All Ratings’ page in the top menu. You will be taken to the All Ratings page. On this page you can filter the ratings by Happy, Satisfied and Unhappy and indicate if you only want to view ratings with WOW’s and/or comments. You can view this data for the last 7 days, last 30 or all time. You can also choose to view this data for your entire team, an individual team member or your customers. To view for a customer simply filter by their email address or their domain name. Example: ‘bob@acme.com’ or just ‘acme.com’ – no quotes needed.
The top section will show you trends for your different rating types and your overall customer happiness. It will also display each individual rating below so you can see details. All of this data can be downloaded into a .CSV file.
Remember – you can also get a summary of your teams performance emailed to you daily or weekly by activating this notification.
Advanced Reporting
In addition to the general reporting capabilities, customers on paid plans have access to Hively’s advanced reporting features. To access this, select ‘Actions’, then ‘Reporting’ from the main menu.
Pre-built reports
Hively provides pre-built reports for you that cover the most common reporting scenarios. Specifically:
- All Ratings: Details of all ratings on your account.
- Account Summary: Totals and percentages by rating type at the account level.
- User summary: Totals and percentages by rating type at the user level.
- Leaderboard: This is a multi-part report containing the Account Summary and the User Summary.
There is an ‘all time’ and a ‘last 30 days’ version of each of the above reports. For different periods, you can create a custom report as covered in the next section.
To run a pre-built report in the browser, click the name of the report from the report list on the Reporting page. Reports can be exported as HTML or CSV from the ‘Actions’ menu for each report on the Reporting page. Note: Multi-part reports can’t be exported in CSV format, only HTML.
Custom reports
If the pre-built reports don’t cover your needs, you can build, save and schedule your own reports. To create a report, click the ‘Add Report’ button at the top of the Reporting page. Choose a name and select your fields and filters. Click ‘Create Report Type’ when you’re done.
Tip: If you’re not sure which fields and filters to select, run a pre-built report that is similar to yours. At the top of the report you’ll see the fields and filters used to create that report. That could be a starting point for creating your report.
Multi-part reports
Multi-part reports can be used to combine multiple reports into one. The ‘Leaderboard’ pre-built report is an example of a multi-part report.
To create a multi-part report, click the ‘Add Multi-part Report’ button at the top of the Reporting page. From there, choose a name for the report and select the reports that you want to be included in your report. Any single-part report can be included in a multi-part report.
Multi-part reports can be run in the browser and exported as HTML, but cannot be exported as CSV.
Scheduling
Any pre-built or custom report can be scheduled to run automatically and sent to one or more email address. You can schedule a report from the main Reporting page. Find the report you want to schedule in the list of reports and select ‘Schedule’ from the ‘Actions’ drop-down for that report. Fill in the run date, frequency, recipients and format and click ‘Schedule report’.

How can I get this type information on my team, MAU Human Resources.
We currently have two on the team, but I will shortly be adding a third.
I need this info for 2012 by quarter, if available.
Thank you!
Hi Angela,
This information is available on the ‘All Ratings’ page inside of Hively. Free plans can access data for the previous 7 days, while Premium plans have access to the full set of data.